Case study · Community project · Garden Grove, CA
Six hours to help neighbors find emergency resources
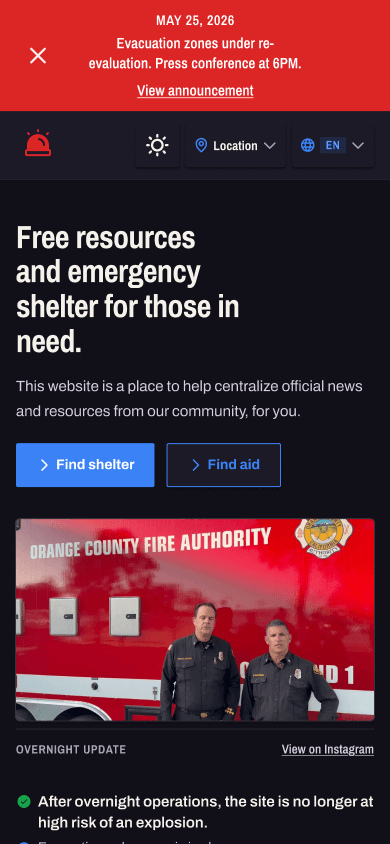
When a chemical leak forced Garden Grove residents to evacuate in May 2026, updates and offers of help were scattered across websites and social feeds. I designed and built ggspill.com that night to bring them together.
Role
Designer and developer · solo
Timeline
May 23 to 27, 2026 · launched within six hours of the evacuation orders
Team
Just me, with neighbors on social media as the feedback loop
Tools
Figma, Cursor, Next.js, Tailwind, Leaflet, Claude for translation
Context
Independent community project · not a government site
03 · AT A GLANCE
Research, impact, and lessons.
6h
from evacuation orders to launch
11k
unique visitors in four days
8
languages, with 400+ translation uses
Residents' requests shifted the site from maps toward practical aid, and shared screenshots showed the need for links that stayed current and kept the reader's language. I designed and launched the site solo in six hours. In four days it reached 11,000 visitors, with eight language options and 400+ uses of translation. The lesson: make sharing part of the first release. Source links and automatic expiry help residents check whether an offer of aid is still available.
Featured conversation · Podcast appearance
The story behind GG Spill, in my own words.
I joined The Leading in a Crisis Podcast to talk about my experience designing and building GG Spill for my community during the evacuation.
Episode 83 · Volunteer Turns Chaos Into Clarity With A Community Crisis Website
Listen on Spotify (opens in a new tab)04 · THE IMMEDIATE NEED
Make the next useful update easy to find.
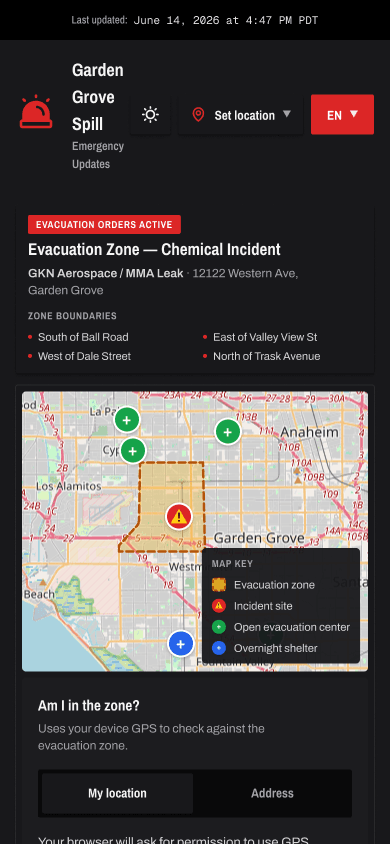
Roughly 50,000 residents were under evacuation orders.1 They needed shelter information, official updates, and practical help on a phone. I organized the site around those tasks and made language selection the first step.
05 · LANGUAGE AND TRUST
A shared link should open in the reader's language.
The language choice persists in the URL and a cookie. A Vietnamese link opens in Vietnamese. For the translation pipeline, I used a glossary to preserve street names, agency names, and hotline numbers.
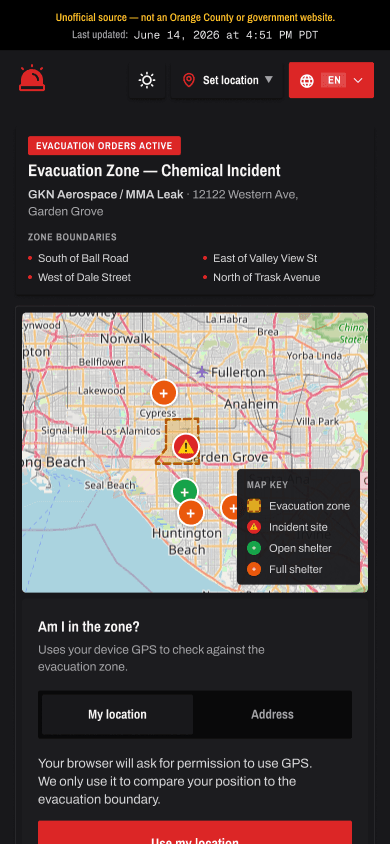
I labeled official updates separately from community aid and linked each resource to its source. The site also identifies itself as independent and unaffiliated with government agencies.
06 · KEEPING AID CURRENT
A listing needs an end time as much as an address.
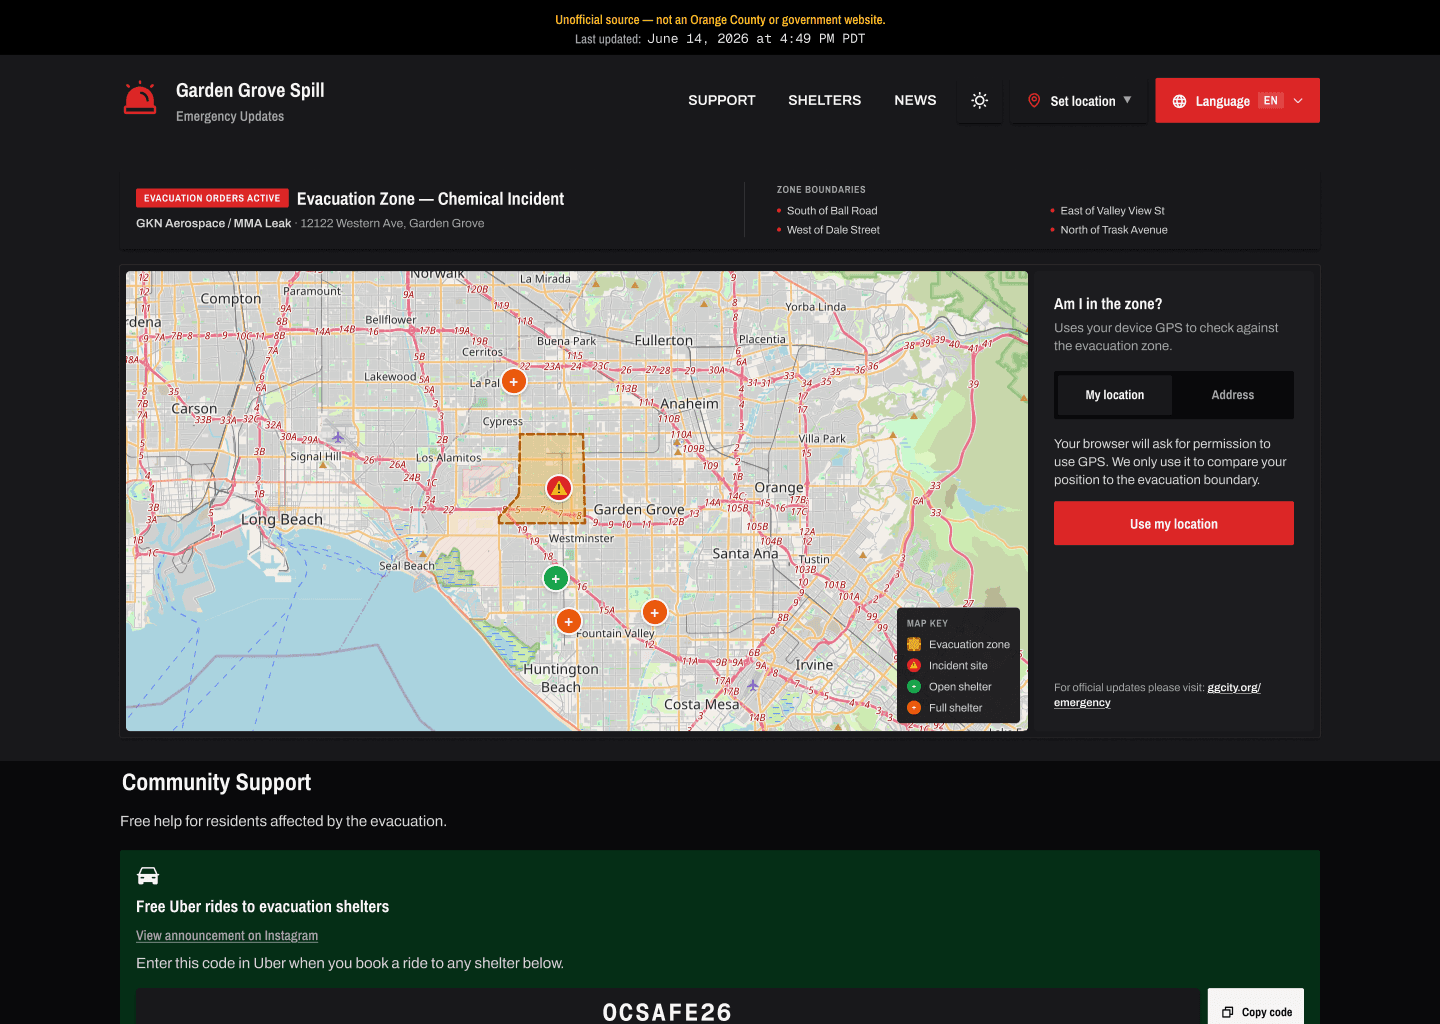
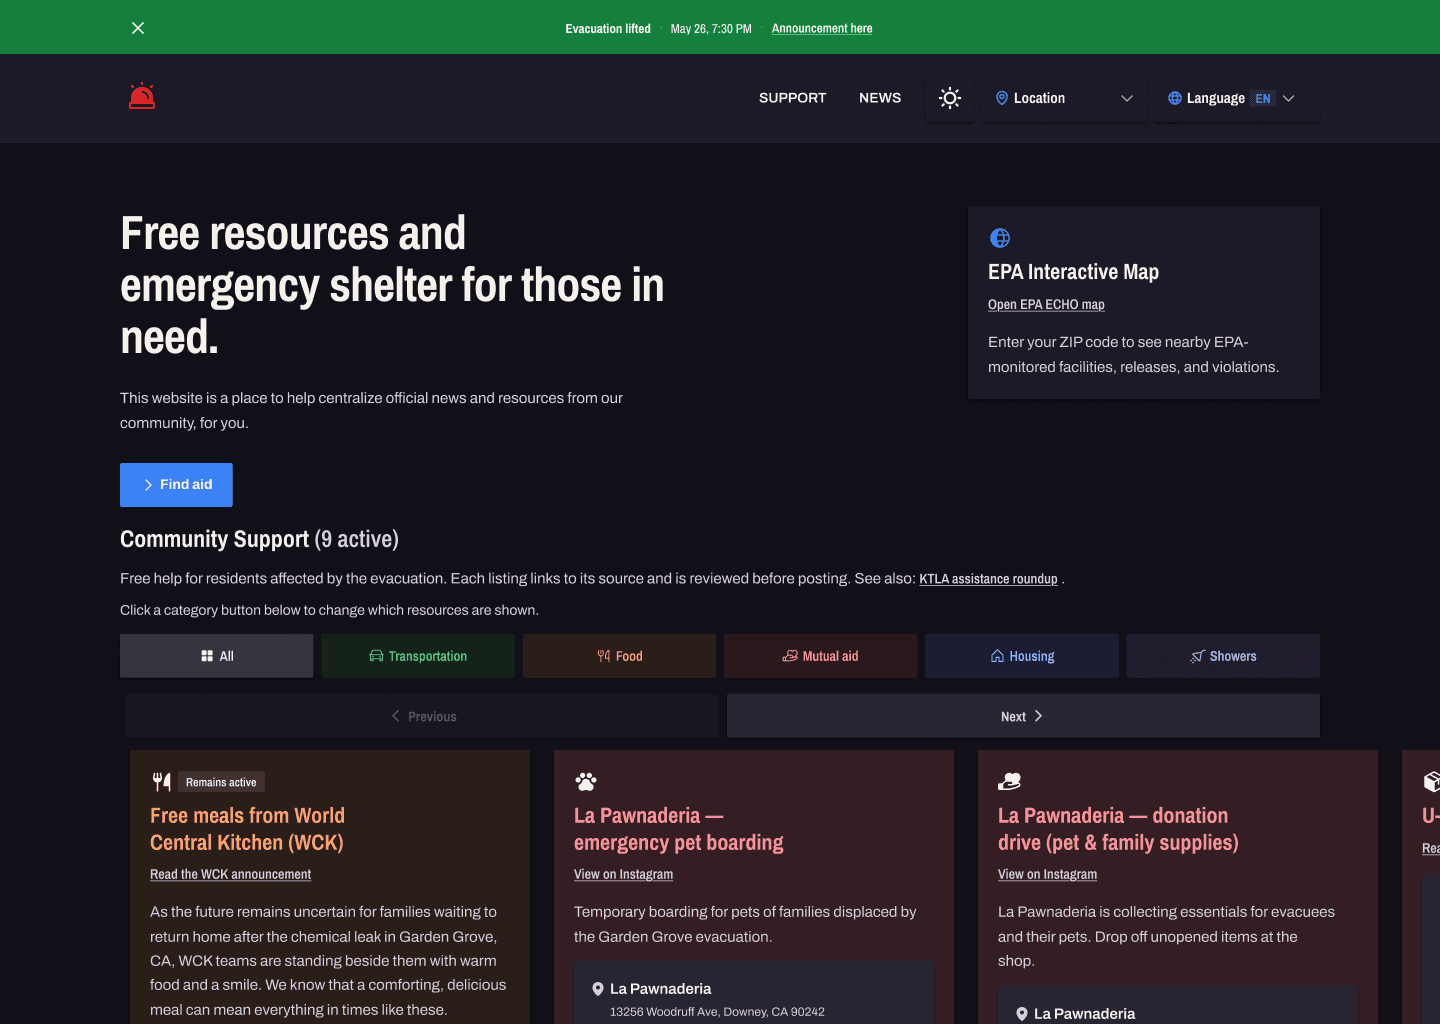
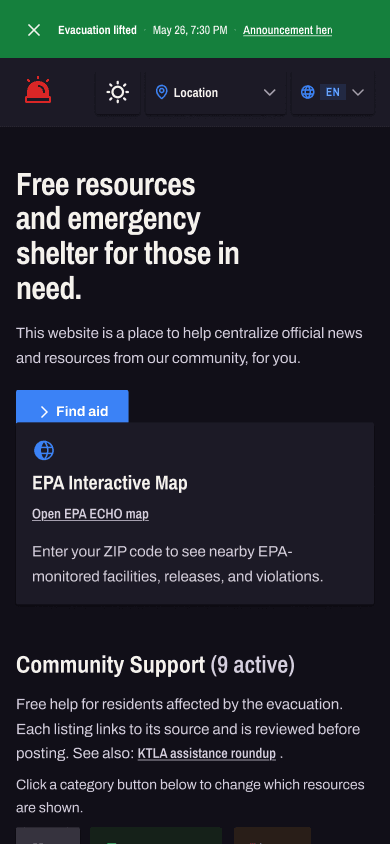
Free rides and meals had deadlines. I gave each resource an expiry time so it would move into the archive automatically. Category filters helped residents find the type of support they needed.
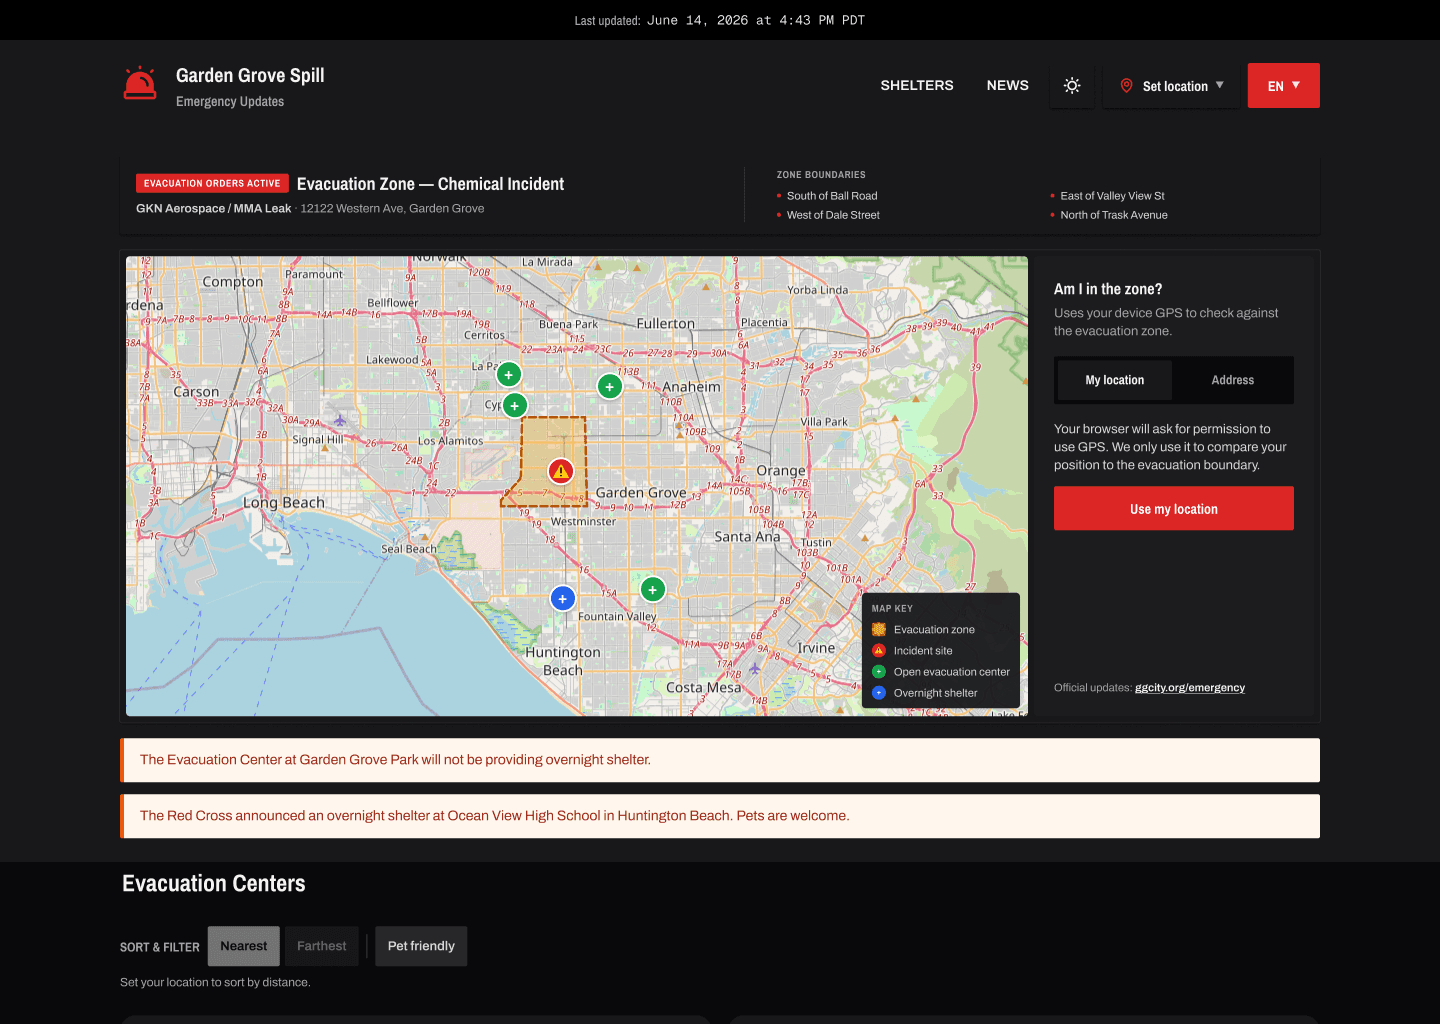
The map answered another immediate question: “Am I in the zone?” It showed evacuation boundaries and closures, then the repopulation area. Location checks stayed on the reader's device.
Residents were sharing screenshots of resource cards. Within a day, I added copy links that opened a specific card in the reader's language. Unlike a screenshot, the linked listing could reflect updates and expiry.
07 · BUILDING DURING THE INCIDENT
An earlier concept got the first version out that night.
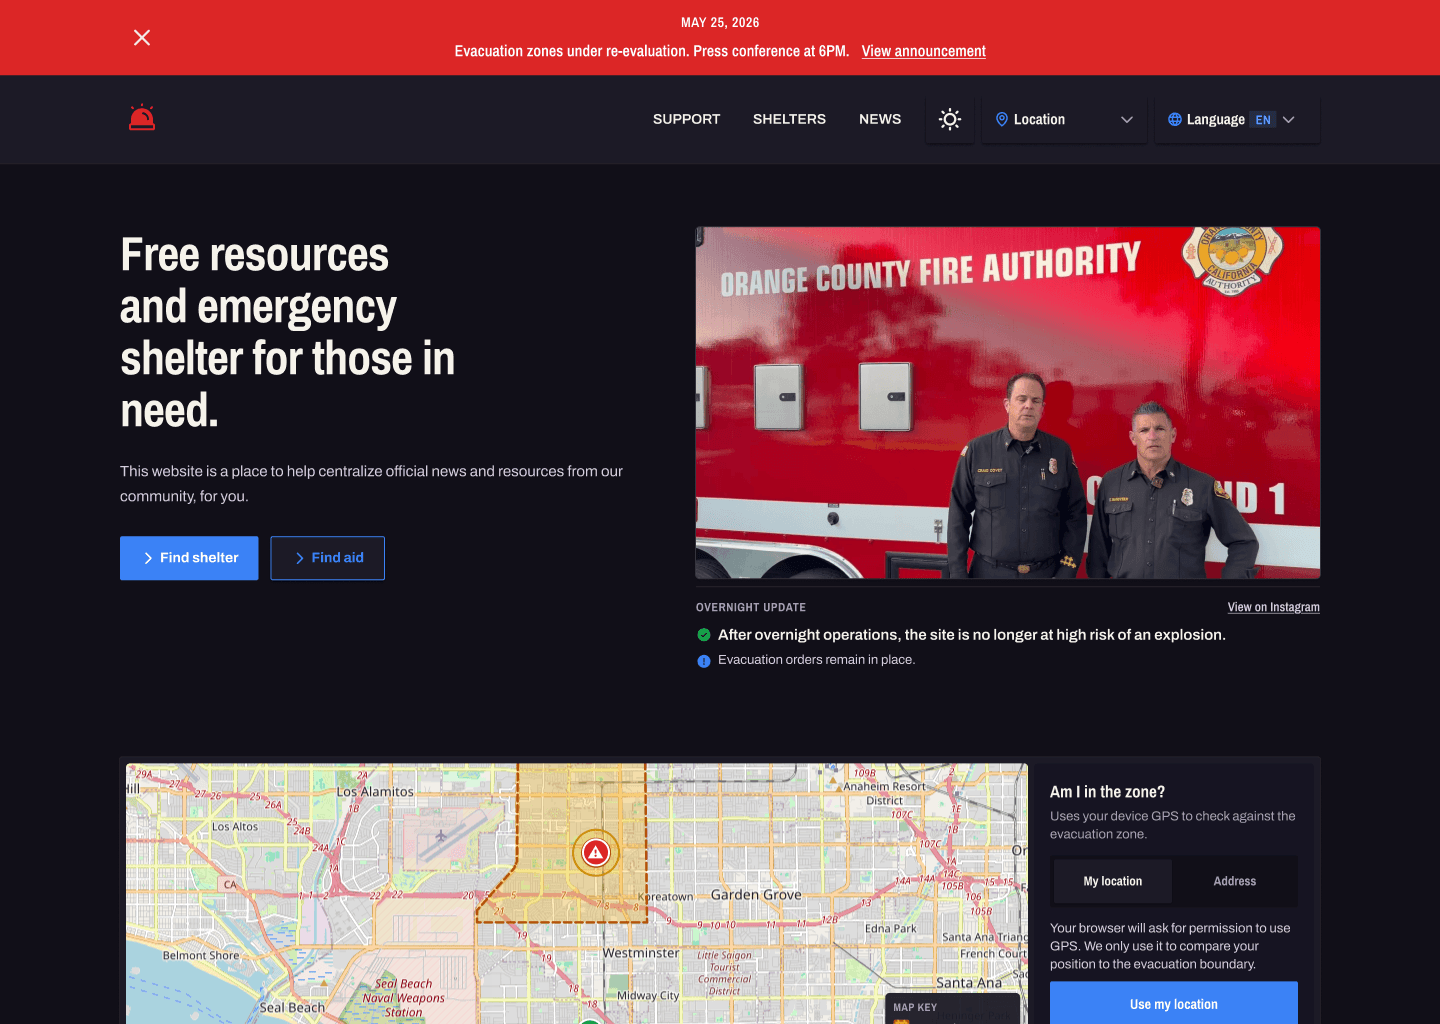
I adapted an emergency-alert concept I had previously explored in Figma. Its status bar, map, shelters, and hotlines gave me a starting structure. I brought the frames into Cursor, built the site, and launched within six hours of the evacuation orders.
The first version led with the map. As residents asked for practical help, I moved community support forward and added categories, expiry, and sharing. When the evacuation lifted, the status changed and the site shifted toward return-home information and an archive.
Let residents shape the resource card
I explored three card layouts and chose the distance-led direction. Requests from people using the site then added source links, category tags, end times, and the copy-link action.
08 · COMMUNITY RESPONSE
11,000 neighbors reached in four days.
I shared the site in neighborhood groups and visited the Freedom Hall evacuation center with a handwritten sign. Across the incident, the site recorded:
11k
unique visitors in four days
17k
page views across the incident
400+
uses of the translation control
Thanks for putting this together, Victor! I'm in the evacuation zone and shared this with some community members.
Residents' replies confirmed that people were finding and sharing updates. I later joined The Leading in a Crisis Podcast to share my experience building GG Spill.2
09 · WHAT I WOULD CHANGE
Sharing belongs in the first version.
I would launch with resource links from day one. Screenshots were circulating before copy links existed, and they could not reflect changing availability.
The strongest decisions came from practical needs: choose a language, check a source, find help that is still available. The site remains online with its archive, preserving a starting point for future community response.
10 · SOURCES
Sources
- City of Garden Grove emergency updates, ggcity.org/emergency; Orange County Fire Authority blast-radius modeling via the LA Times; evacuation lifted May 26, 2026, 7:30 PM.
- The Leading in a Crisis Podcast, EP83, Volunteer Turns Chaos Into Clarity With A Community Crisis Website.
- The site: ggspill.com. Source code: github.com/vector-y/hazardOC.